 Budget
Dashboard
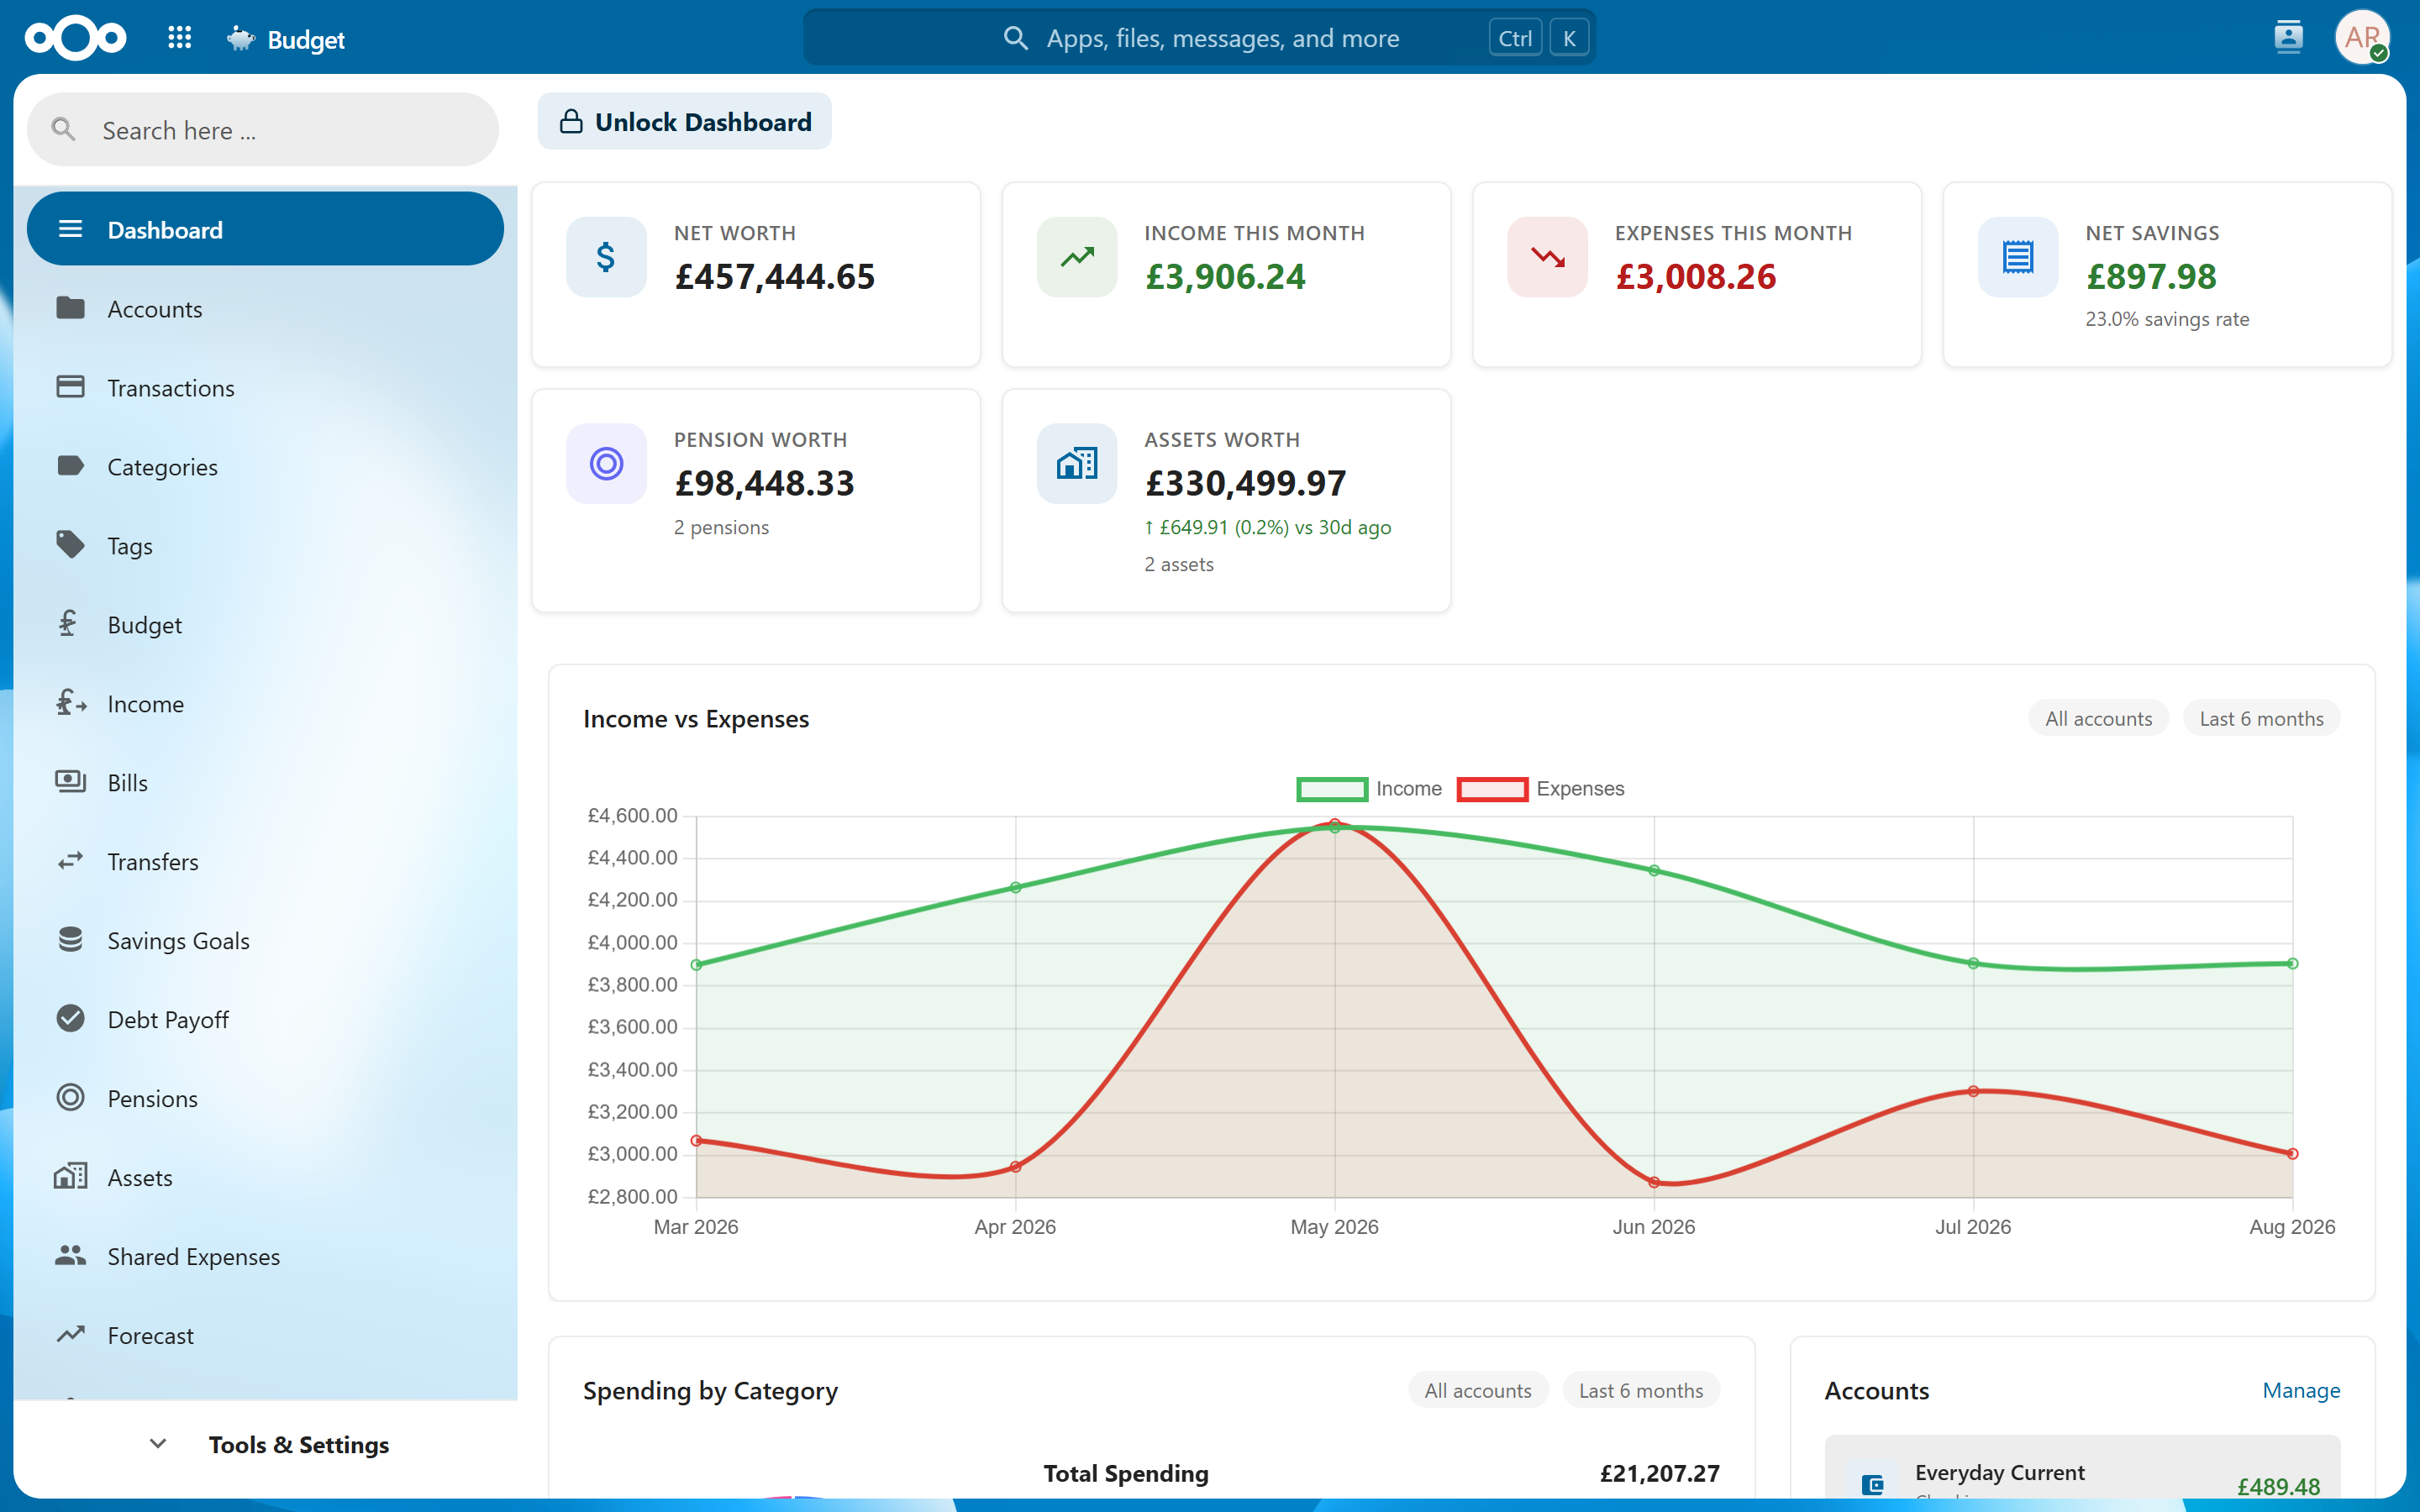
The Dashboard is your customizable financial overview, featuring 28+ tiles that display key metrics, charts, and summaries at a glance. Arrange tiles to suit your workflow and see your finances update in real time.
Overview#
The Dashboard is the first screen you see when opening Nextcloud Budget. It provides a consolidated view of your financial health through configurable tiles that display account balances, budget progress, spending trends, upcoming bills, and more. All tiles auto-update when underlying data changes, so your dashboard always reflects the latest state of your finances.
Dashboard Layout#
The dashboard is organized into two sections:
- Hero tiles - Large metric cards displayed prominently at the top of the dashboard. These show your most important financial numbers (net worth, monthly income/expenses, savings rate, etc.) with large, easy-to-read values and optional subtext.
- Widget tiles - Smaller cards arranged below the hero section. These provide detailed views such as transaction lists, charts, budget breakdowns, and actionable summaries.
Both sections auto-update when you add transactions, update budgets, or make other changes elsewhere in the app.
Unlocking the Dashboard#
To customize your dashboard, click the Unlock Dashboard button in the top-right corner. When unlocked:
- A hint appears: "Drag tiles to reorder your dashboard"
- Each visible tile shows an X button for hiding it
- The Add Tiles menu becomes available
- Configuration icons (gear icons) appear on tiles that support customization
Tip: Unlock the dashboard whenever you want to rearrange, show, or hide tiles. Lock it again when you are done to prevent accidental changes.
Rearranging Tiles#
While the dashboard is unlocked, drag and drop tiles to reorder them:
- Click and hold a tile
- Drag it to the desired position
- Release to drop it in place
Hero tiles and widget tiles have separate drag areas -- you can reorder tiles within each section, but hero tiles stay in the top section and widget tiles stay in the bottom section. Your tile order is saved automatically.
Showing and Hiding Tiles#
Click the Add Tiles dropdown (visible when the dashboard is unlocked) to see all available tiles grouped by category:
- Hero metrics
- Insights
- Budgeting
- Charts
- And more
To show a hidden tile, click its name in the dropdown. To hide a visible tile, click the X button on the tile. All changes are saved automatically.
Note: Hiding a tile only removes it from the dashboard display. No data is deleted, and you can show the tile again at any time.
Hero Tiles#
Hero tiles occupy the top section of the dashboard. Each displays a large metric value with optional subtext or trend indicator:
| Tile | Description |
|---|---|
| Net Worth | Total assets minus liabilities across all accounts, plus any assets and pensions you track. A liability you have overpaid counts as an asset. |
| Income This Month | Total income received in the current budget month |
| Expenses This Month | Total spending in the current budget month |
| Net Savings | Income minus expenses, with savings rate percentage |
| Pension Worth | Combined value of all pension accounts |
| Assets Worth | Total value of asset-type accounts |
| Savings Rate | Percentage of income saved in the current budget month |
| Cash Flow | Net money flow across all accounts |
| Budget Remaining | Amount left to spend within your budget for the current budget month |
| Budget Health | Overall budget adherence indicator |
| Account Income | Income for the currently selected account |
| Account Expenses | Expenses for the currently selected account |
The budget month is the calendar month unless you have set a Budget start day in Settings. With one set, these tiles cover your current budget cycle, the same period the Budget page shows, and list its dates under their labels. With a start day of the 25th, they cover the 25th to the 24th of the next month, including any envelope carryover in Budget Remaining.
Shared accounts: If other users have shared their accounts with you, those accounts are included in all dashboard summary calculations — Net Worth, Income/Expenses This Month, currency breakdowns, and account counts. Shared accounts are marked with a sharing indicator.
Widget Tiles#
Widget tiles provide detailed views, lists, charts, and actionable information:
| Tile | Description |
|---|---|
| Accounts | Account list with balances (supports customization via gear icon) |
| Budget Alerts | Over-budget or near-limit categories (choose which categories it covers via the gear icon) |
| Upcoming Bills | Bills due soon with amounts and due dates |
| Budget Progress | Visual progress bars for budget categories |
| Savings Goals | Progress toward savings targets |
| Spending by Category | Chart showing spending distribution — click a slice or bar to see that category's transactions for the charted period |
| Top Categories | Highest-spending categories this period |
| Recent Transactions | Latest transactions across accounts. A split names the categories its parts went to, with each part’s amount on hover |
| Account Performance | Account balance trends over time |
| Budget Breakdown | Detailed budget allocation and usage |
| Goals Summary | Overview of all financial goals |
| Payment Breakdown | Spending by payment method or account |
| Reconciliation Status | Accounts needing reconciliation |
| Quick Add Transaction | Add a transaction without leaving the dashboard |
| Monthly Comparison | Compare spending month-over-month |
| Large Transactions | Notable high-value transactions |
| Weekly Spending | Spending totals by week |
| Unmatched Transfers | Transfers that may need matching |
| Category Trends | Category spending over time |
| Bills Due Soon | Upcoming bill payments |
| Income Tracking | Income progress and projections |
| Pension Projection | Projected pension value and progress toward your target (off by default) |
| Recent Imports | Latest file imports and their status |
| Rule Effectiveness | How well auto-categorization rules are working |
| Spending Velocity | Rate of spending compared to budget |
| Income vs Expenses | Chart comparing income and expenses over time |
| Cash Flow Forecast | Projected future balances |
| Year-over-Year | Annual comparison chart |
Tile Date Ranges#
Chart and list tiles cover a date range you choose. Unlock the dashboard, click the gear icon on the tile, and pick one under Date Range:
| Range | Covers |
|---|---|
| Last 30 days | The 30 days ending today |
| Last 90 days | The 90 days ending today |
| Last 6 months | Six months back from today |
| Last year | Twelve months back from today |
| Current budget period | Your current budget cycle |
These are rolling windows measured back from today, not calendar months -- "Last 30 days" on the 3rd of a month reaches back into the previous month.
Current budget period is offered on Spending by Category, Top Categories and Budget Progress. It follows the Budget start day in Settings, so if your salary lands on the 25th and you set that as your start day, the tile covers the 25th to the 24th -- the same cycle the Budget page and your budget alerts use. Set it on these tiles when a tile's figures seem to disagree with your budget: a calendar-month window cuts a cycle like that in half, so the bills paid at the start of it fall outside the tile.
Spending by Category shows the days it is covering in its header, so a budget-period tile reads "25 Aug - 24 Sept" rather than repeating the setting.
Some tiles ask a different question and get a different setting:
| Tile | Setting | Choices |
|---|---|---|
| Upcoming Bills, Bills Due Soon | Look ahead | Next 30 / 60 / 90 days |
| Cash Flow Forecast | Forecast horizon | Next 3 / 6 / 12 months |
| Year-over-Year | Years to compare | Last 2 / 3 / 5 years |
Monthly Comparison, Debt Chart and Income Tracking have no range setting: the first two are fixed comparisons, and Income Tracking reports a monthly rate rather than a total for a period.
The balance-history tiles (Net Worth History, Asset Value History) and Income vs Expenses chart a span rather than a single cycle, so they do not offer the budget-period option.
Accounts Tile Configuration#
The Accounts tile supports additional customization. When the dashboard is unlocked, a gear icon appears on the Accounts tile header. Click it to open a configuration panel where you can:
- Reorder accounts - Drag accounts to change their display order on the dashboard
- Toggle visibility - Use checkboxes to show or hide individual accounts
Hidden accounts are not deleted -- they still exist on the Accounts page and continue tracking transactions. They simply do not appear in the dashboard Accounts tile. Configuration saves automatically.
Tip: Use this to focus your dashboard on the accounts you check most frequently, while keeping less-used accounts accessible from the Accounts page.
Budget Alerts Tile Configuration#
The Budget Alerts tile shows every category at or above your alert threshold, and that includes categories whose budget was worked out automatically from their bills and recurring income rather than typed in by you (see Automatic Budgets from Recurring Items). A bill converted to a monthly figure can sit well above that figure in the month it is actually paid, so those categories can crowd out the budgets you set yourself.
Unlock the dashboard and click the gear icon on the Budget Alerts tile to choose what it covers:
- Only categories with a budget I set - Leaves out every automatically derived budget, so only the limits you typed in can raise an alert
- Per-category toggles - Every category with a budget in play is listed with its current limit, and unticking one stops it alerting. Categories whose budget came from a bill are marked, so it is clear which ones the checkbox above covers
Both are saved with your account rather than with the tile, so budget alert notifications and the digest use the same list. Muting a category changes only what alerts: the figures on the Budget page, the budget tiles and the Nextcloud dashboard widget still count it in full.
If a filter leaves nothing to show, the tile stays on the dashboard and says how many categories are muted, so you can always reach the gear icon to change your mind. With no filter set, the tile hides itself when there is nothing to report, as before.
Locking the Dashboard#
When you are finished customizing, click Lock Dashboard to prevent accidental changes. Locking the dashboard:
- Hides the Add Tiles menu
- Removes X buttons from tiles
- Hides gear icons on configurable tiles
- Disables drag-and-drop reordering
Your layout is preserved exactly as you left it.
Related Features#
- Accounts - Manage the accounts shown in the dashboard
- Budget - Set budgets that drive dashboard metrics
- Bills - Track recurring bills shown in dashboard tiles
- Savings Goals - Goals displayed in the Savings Goals tile
- Forecast - Projections powering the Cash Flow Forecast widget
- Reports - Detailed analysis beyond dashboard summaries
- Nextcloud Integration - Budget widgets for Nextcloud's own dashboard
Settings#
Dashboard state -- including tile visibility, order, and per-tile configuration -- is saved per-user automatically. No manual save action is required. Changes persist across sessions and devices.