 Budget
Forecast
The Forecast tool predicts your future account balances by analyzing historical spending and income patterns. Use it to plan ahead, avoid overdrafts, and understand how your financial habits project into the future.
Overview#
Forecasting uses your transaction history to identify regular income, recurring expenses, and seasonal variations. It then projects those patterns forward to show where your account balances are heading. The What If? section lets you try out changes, such as a pay cut or a new bill, without saving anything.
Setting Up a Forecast#
Open Forecast from the sidebar. The forecast covers your accounts, including ones shared with you and leaving out any you have excluded from reports, and the Forecast Period at the top of the page sets how far ahead it looks: 3, 6, 12 or 24 months.
The forecast learns from your history, so it needs at least one complete month of transactions before it shows anything. Until then the page says there is not enough data.
Tip: The forecast gets steadier as your history builds up. The Forecast Confidence card at the top of the page shows how much it has to go on, so treat a forecast with only a month or two behind it as a rough guide.
How It Works#
The forecast engine analyzes your transaction history across several dimensions:
- Regular Income Patterns — Identifies recurring deposits (salary, freelance payments, benefits) by matching amounts, frequencies, and descriptions.
- Recurring Expenses — Detects fixed and semi-fixed outflows such as rent, subscriptions, and loan payments. Active bills are included automatically.
- Seasonal Variations — Recognizes spending that changes by season or month (e.g., holiday gifts in December, back-to-school expenses in September).
- Average Spending by Category — For irregular day-to-day spending (groceries, dining, fuel), the engine calculates category-level averages and projects them forward.
The combination of these factors produces a projected daily balance for each day in the forecast horizon.
The history it learns from is the twelve complete months before the current one. The month in progress is left out, as a few days of it would read as a month in which almost nothing came in. A trend, income or spending rising or falling, is only followed once there are at least three complete months to go on; with fewer, the forecast carries your monthly averages forward as they are. Projected income never falls below the recurring income you have set up for the accounts the forecast covers, so a salary you track keeps arriving in the projection even when a weak month pulls the average down.
Spending is projected at your average over the months the forecast learns from. If it has been rising, the forecast follows the rise; if it has been falling, it assumes you keep spending your average, so a dip does not hide a shortfall. It never projects less than your bills.
Transfers between your own accounts are not counted as income or spending. When the forecast covers accounts in more than one currency, each is converted to your base currency at your exchange rates, as the dashboard does, and an account with no exchange rate is left out of the combined figure. A shared account starts from its balance as of today, the same as one of your own.
Excluding One-Time Items#
Extraordinary amounts — selling a car, an insurance payout, a one-off purchase — distort the averages the forecast extrapolates from. You can mark these as excluded from the forecast in three places:
- Per transaction — tick "Exclude from forecast (extraordinary / one-time)" in the add/edit form. Excluded transactions show a No forecast badge in the transaction list.
- Per recurring bill or income — tick "Exclude from forecast (extraordinary)" on the bill or income; every transaction it generates is excluded automatically.
- Via import rules — add an Exclude from Forecast action to a rule to mark matching transactions automatically on import or bank sync.
Excluded amounts still affect your real account balance — they only stay out of the projection math, so a one-off windfall doesn't inflate next month's expected income.
Reading the Forecast#
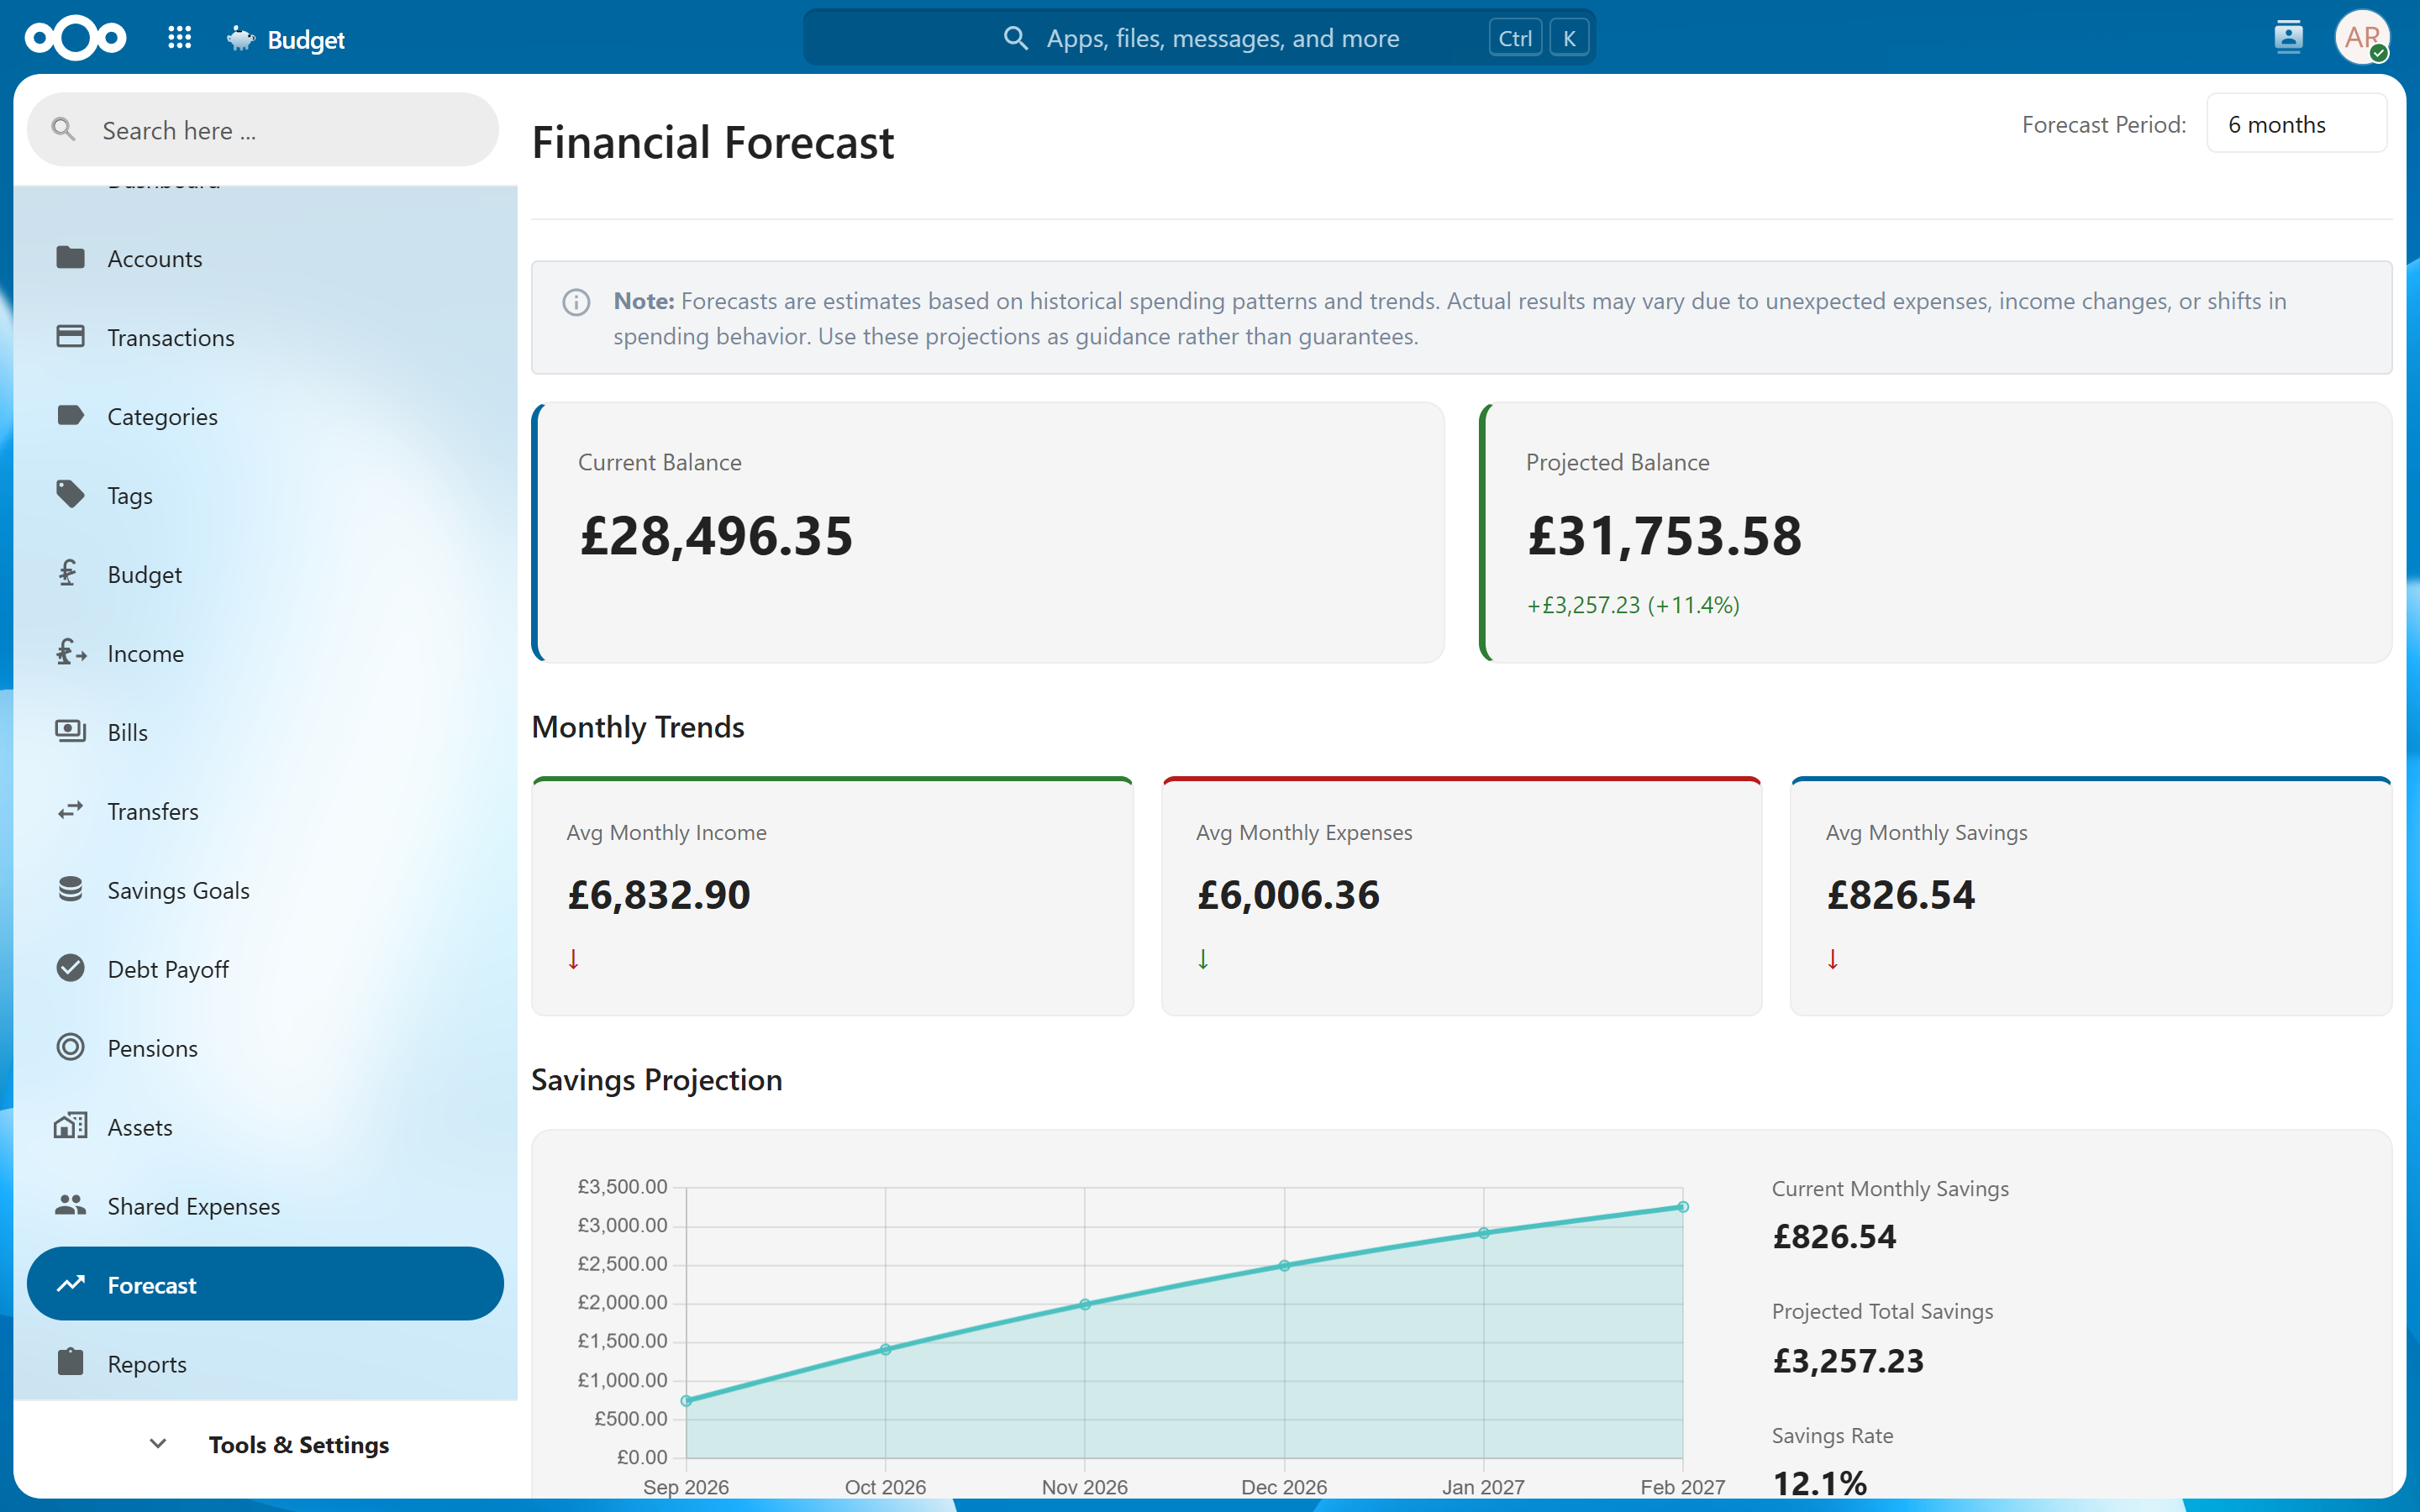
The page runs from top to bottom in four parts.
Summary#
A row of three cards:
| Card | Meaning |
|---|---|
| Current Balance | Your combined balance as of today, the forecast's starting point. |
| Projected Balance | Where the balance is heading at the end of the forecast period, with the change from today in money and as a percentage. |
| Forecast Confidence | How much the forecast has to go on, as a percentage coloured green, amber or red. Under it, Based on N month(s) of data (N transactions) says what it learned from. |
Balance Projection#
The chart draws your projected balance month by month, plus a dashed What if line when you have entered a scenario. Hover over a month to see its projected income and spending in the tooltip. The note under the chart is a reminder that the projection is estimated from your past income and spending, so it is a guide, not a guarantee.
The What If? section sits in the same panel, under the chart.
Monthly Trends#
One row with Avg Monthly Income, Avg Monthly Expenses and Avg Monthly Savings, each with an arrow showing whether it has been rising or falling. Under average savings, N% of income saved gives your savings rate.
Spending by Category#
Your 10 biggest spending categories. If you have more, Show all (N) lists the rest and Show fewer goes back to the top 10.
Negative Balance Warning#
With Forecast Warning Notifications on in Settings, you get a Nextcloud notification when the forecast projects your combined balance below zero. It only warns once the forecast is reliable, which means at least three complete months and ten transactions behind it, so a new user is not warned on the strength of a few days of data. A steady history that really is heading below zero still warns.
Interpreting Key Signals#
- Downward trend crossing zero — Your spending exceeds income at the current rate. Consider adjusting your budget.
- Sharp drops in particular months — Large known expenses (bills, rent) fall in those months.
- Flat or rising trend — Your income comfortably covers expenses and you are likely building savings.
What If?#
The What If? section sits in the Balance Projection panel, under the chart, and lets you try out changes without saving anything.
| Field | What it does |
|---|---|
| Income change (%) | Changes every projected month's income, e.g. -10 for a 10% pay cut. |
| Spending change (%) | Changes every projected month's spending, e.g. -5 to spend 5% less. |
| Every month | An amount added each month. Use a minus for a new bill (-200), a plus for extra income. |
| One-off amount and One-off in | A single amount in one of the forecast's months, e.g. -1500 for a big purchase. |
As you type, the chart gets a dashed orange What if line beside the projected balance. The section tells you where your balance would be at the end of the forecast period, the difference from the forecast, and the lowest point, or the month it would go below zero.
It reruns the forecast's own projected months, so it follows the Forecast Period; changing the period keeps what you typed. Reset clears it. Amounts accept a decimal comma. Income and spending can't be cut below zero, so -100% is the most.
Note: Nothing in What If? is saved or sent anywhere, and leaving the page forgets it. It never creates or changes transactions or bills.
Related Features#
- Dashboard — The Forecast tile shows a summary of your projected balance on the dashboard.
- Bills — Active bills are factored into the forecast as known future expenses.
- Income — Recurring income entries improve forecast accuracy for expected deposits.
- Runway - Works out how many months your savings will last, at your current spending and on budget.
- Accounts — Forecasts are generated per-account or across multiple accounts.
Settings#
Forecast does not have dedicated settings. The historical period and horizon are selected each time you generate a forecast. Your most recent selections are remembered for convenience.